Baseball Research Review # 4 – Are We Really Preventing Injuries?
In this edition of the Baseball Research Review we are going to unravel a recent study in the American Journal of Orthopedics that investigated injury trend in MLB baseball over 18 years!!! The study represents the largest longitudinal analysis of MLB injuries since the expansion to 30 teams and is chock full of interesting findings.
Study: Injury Trends in Major League Baseball Over 18 Seasons: 1998-2015
Authors: Conte, S., Camp, C., Dines, J,.
Background:
As with any professional sport, players spending time on the trainer’s table rather than competing on the field, poses significant costs to the organization. Performance, wins and revenue are all detrimentally affected so it is obviously important to accurately quantify injury trends.
In 2001 Conte released the first epidemiological study on professional baseball players and the results were troubling — especially for pitchers. Not only did the authors demonstrate that trips to the disabled list were on the rise, but that pitchers accounted for 48.4% of all DL stints! A few years later, Posner found similar trends on increasing injury rates in the 2002-2008 seasons.
With the recent spike in ulnar collateral ligament reconstructions, it is surprising to note that there have been very few epidemiological investigations on MLB injury rates, trends and financial implications. This study changes that.
Purpose:
The purpose of this study was to 1) provide a large-scale analysis of injuries occurring in active MLB players spanning the course of 18 years (1998-2015); 2) highlight the financial implications of these trips to the disabled list; and 3) provide a detailed account of the evolution of UCL injuries & reconstructive surgeries since it’s first procedure on Tommy John back in 1974.
Methods:
The authors collected retrospective data from MLB players spanning the years 1998 to 2015. Injury-specific variables included date of placement on DL, length of time on DL, reinstatement date, body part injured and cost of replacement. The starting point of 1998 was chosen as it was the year in which the number of teams expanded to 30 and provided consistency in number of active rosters spots (25 players). UCL injury analysis was collected separately and started with the first surgery in 1974.
Cost of players on the DL was calculated by prorating a player’s daily salary and multiplying by the number of days missed. For example, if a player’s annual salary was $1,820,000, his daily salary would be $10,000 and therefore 10 days on the DL would result in a financial cost of $100,00. From this would be subtracted a prorated daily salary for a replacement player — equated to the league minimum each year.
Results:
DL Stints
- In the years from 1998-2015 there have been 8357 trips to the DL, at an average rate of 464 designations / year.
- The number of players placed on the DL and the total number of days have steadily increased (P < .001 and P = .003 respectively). In 1998, 387 players made it to the DL and in 2015 that number grew to 536.
- Upper body injuries accounted for the predominant percent of injuries seen (20.6% shoulder & 19.6% elbow), with leg/knee (9.8%) and upper leg/thigh (9.6%) being the least frequent.
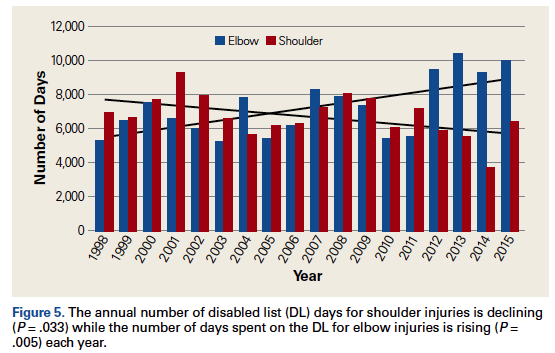
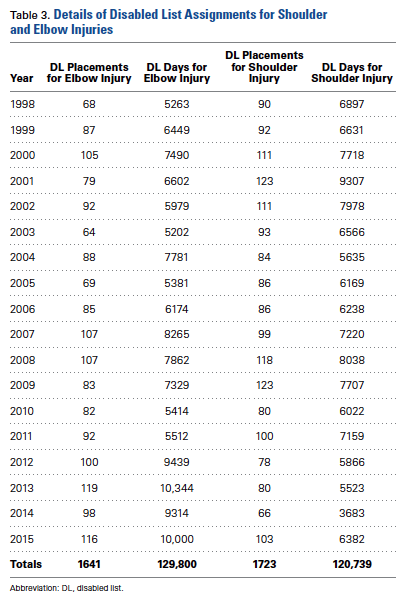
- The total number of shoulder injuries have declined, while elbow injuries have climbed during this time. The same relationship was found for days spent on the DL for these two groups.
All images used with permission from The American Journal of Orthopedics. Conte S et al. Am J Orthop. 2016 March;45(3):116-123. https://www.mdedge.com/amjorthopedics/article/106556/sports-medicine/injury-trends-major-league-baseball-over-18-seasons.”
Financial Findings
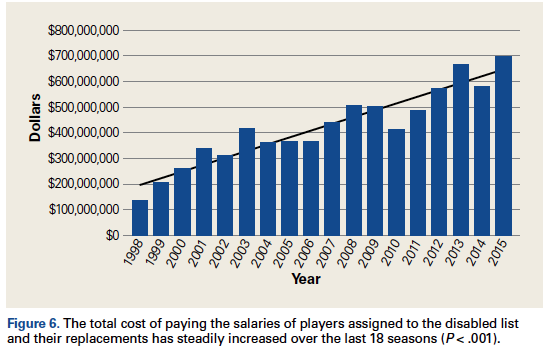
- Roughy $7.6 billion has been spent on injuries and replacement players in the studied time period, with a mean yearly cost of around $425 million.
- The mean yearly cost is growing. Almost $700 million was spent in 2015, as compared to $360 million in 2005 and $136 million in 1998.
UCL Injuries
- Since 1974 there have been 400 UCL reconstructions with the overwhelming majority not surprisingly occurring in pitchers (n = 361); followed by outfielders (n = 16), infielders (n = 14) and catchers (n = 9).
- We are growing at an alarming rate. From 1996-2005, there were 123 reconstructions performed. In the following ten years, from 2006-2015, that number soared to 225!
Discussion:
With this study, the authors have provided the most comprehensive MLB epidemiological report on injuries and their financial implications to date. Moreover, they have successfully quantified the trends of the Tommy John ‘epidemic’. The information gained from this study provides a number of interesting talking points to which we will address now.
There are more players heading to the disabled list in today’s game than there were eighteen years ago. A number that has grown from 387 designations to 536 in that span. Maybe players were more inclined to ‘tough it out’ back then. Maybe there is more financial incentive to take a precautionary stint on the DL today in hopes of preventing major injury down the road. Maybe performance enhancing drugs have something to say about it. The multifactorial nature of injury & it’s prevention muddies the water and allows us to really only speculate — which we will do shortly.
What we can definitely agree upon is the shocking financial ramifications of games lost to injury. Almost $700,000,000 was spent on salaries sitting on the sidelines in 2015!!! According to Spotrac, in 2016 the Los Angeles Dodgers are expected to have roughy $54,000,000 sitting on the DL alone (without accounting for Kershaw). That’s more money not playing than the salary of the 25 man roster for the Padres, Athletics, or Rays.
Ten years ago, in 2005, the amount lost to the DL was almost half that amount – $360,000,000. In 1998, it was only $136,000,000. Of course, this trend in rising costs correlates to the increase in league salaries & generated revenue during that time span.
Elbows and Shoulders:
What intrigues us the most about this study is the reciprocal relationship between the trends in shoulder and elbow injuries. As noted above, there has been a steady decline in the prevalence of shoulder injuries complemented with an increase elbow injuries.
Now, in fairness to the data itself, these aforementioned trends are not that statistically strong. The sample size is small and the p values aren’t anything to write home about (0.023 and 0.015) and aren’t the end all be all to begin with. The ‘trend’ in declining shoulder injuries and inclining elbow injuries on the whole far from conclusive, but there are certainly trends. As can be seen in the UCL analysis, however, this is obviously not the case for Tommy John reconstructions. We are definitely trending upwards in that department.
The authors of the study acknowledge that the exact etiology for the decline in shoulder injuries is unknown but offer up a number of potential reasons; from increased emphasis on shoulder rehab and scapular stabilization to improving coordination and reducing glenohumeral internal rotation deficits.
Every intervention needs a rationale.
The BPG echoes the statements of the authors in that it is impossible to decipher the exact reason for a downward trend in shoulder injuries. We do, however, have a different vantage point on the reciprocity of the elbow / shoulder that may shed light on the injury spectrum in general.
In our webinar we talked about the concept of injuries being a ‘systems problem’. The human body can be thought of a complex system with an infinite number of options for executing a movement. With each repetition of a movement, for example throwing a baseball, we are expressing innumerable variations of a pattern. Think of movement variability a small deviations from a template. This variation is healthy as it allows for adaptability and off-loads tissues with each rep.
This GIF is a perfect example of that concept. This is healthy variation! I’d argue that you wouldn’t want them to be the exact same. (Many thanks to Rob Friedman for the GIF.)
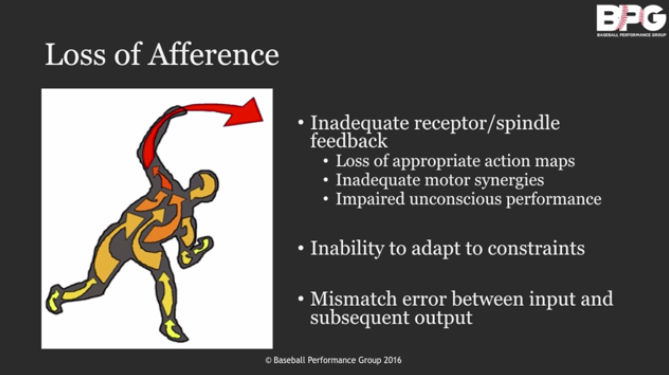
A systems problem, as we tend to think of it, is a loss of this complexity more often associated with a decline in motor variability as a fallout from poor afferent sensory information. In layman’s terms, when the sensory information from a joint is inadequate, we lose flexibility in our movement options for that joint.
If that joint is compromised from a coordination standpoint, so too will be the next component in the chain — the elbow. It follows that a reduction in the sensory input coming from the shoulder will affect its ability to express coordination with the elbow. A systems problem.***
If we’ve spent time so much time on strengthening the shoulder and decreasing internal rotation deficits and shoulder injuries are declining, shouldn’t we just do the same thing for the elbow?
No, probably not.
Our contention is that what we may have actually been doing is simply increased tissue capacity of the shoulder. Without improving the sensory information, and therefore movement capacity, we might be missing a major limiting factor. Bands, weights, and static stretching may in fact be contributing to the issue by pushing the limiting factor to the elbow.
Maybe getting bigger, faster, and stronger is simply adding more demand on a system that doesn’t have enough options. Maybe we haven’t really made a dent in the overall system’s resilience. Injury rates are by no means declining.
Maybe, instead, we need to improve the quality of afferent sensory information of the shoulder to allow for better movement at the elbow?
As of right now, we cannot know the answer for certain. Our model of performance leads us to believe that without adequate afferent sensory information from the joint we are limiting the overall adaptability of the movement system. Masking this with tissue capacity exercises may not be the answer.
That is why at the Baseball Performance Group we place an emphasis on improving afferent sensory information.
That’s a wrap for this week’s Baseball Research Review. If you’d like to receive these reviews directly to your inbox, feel free to subscribe to our newsletter below. And as always, if you have any questions, concerns or comments don’t be afraid to comment below!
Dr. Stephen Osterer
*** If the systems problem concept is still difficult to digest, then please head over and watch our webinar on the topic. Or send us an email.
For more information on disabled list data, Baseball Heat Maps has an incredible database!
All Images used with permission from The American Journal of Orthopedics. Conte S et al. Am J Orthop. 2016 March;45(3):116-123. https://www.mdedge.com/amjorthopedics/article/106556/sports-medicine/injury-trends-major-league-baseball-over-18-seasons.